Debugger
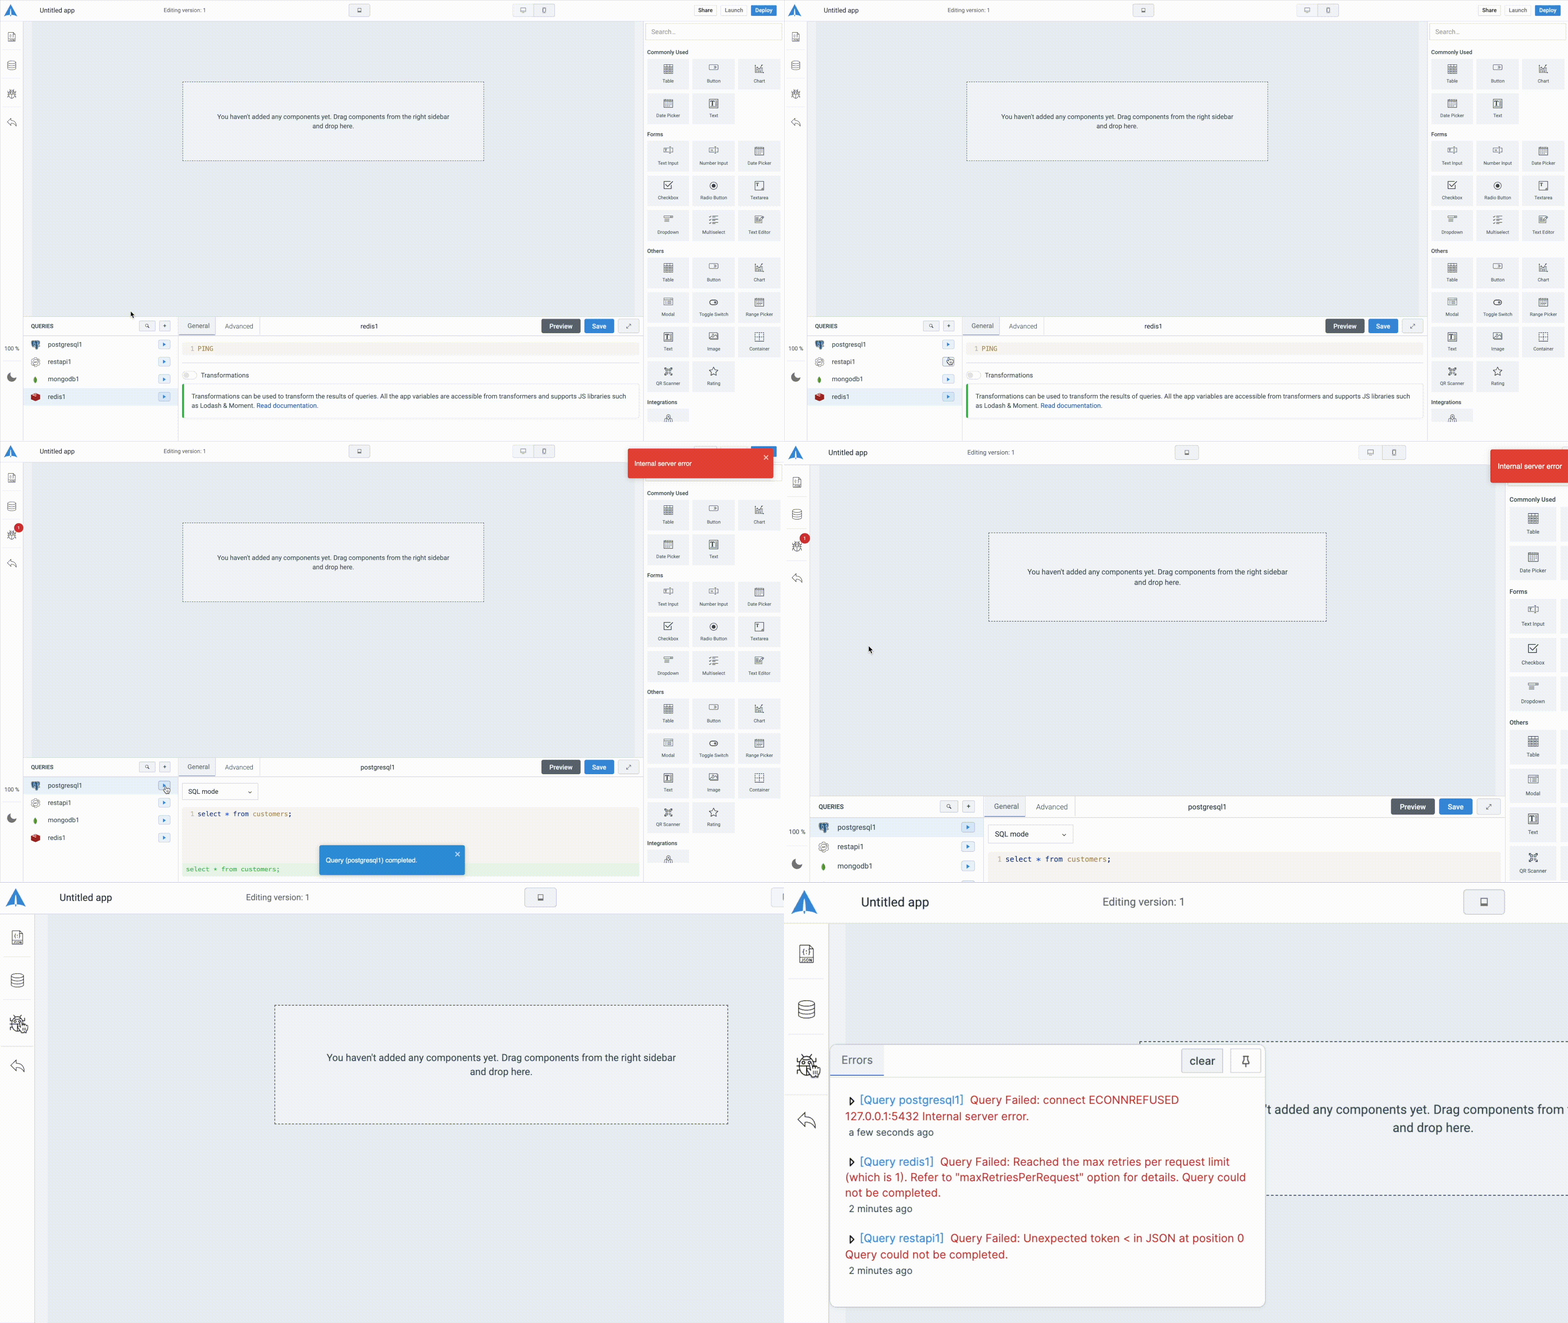
The debugger captures errors that happens while running the queries. For example, when a database query fails due to the unavailability of a database or when a REST API query fails due to an incorrect URL, the errors will be displayed on the debugger. The debugger also displays relevant data related to the error along with the error message. Debugger is located on the left-sidebar.

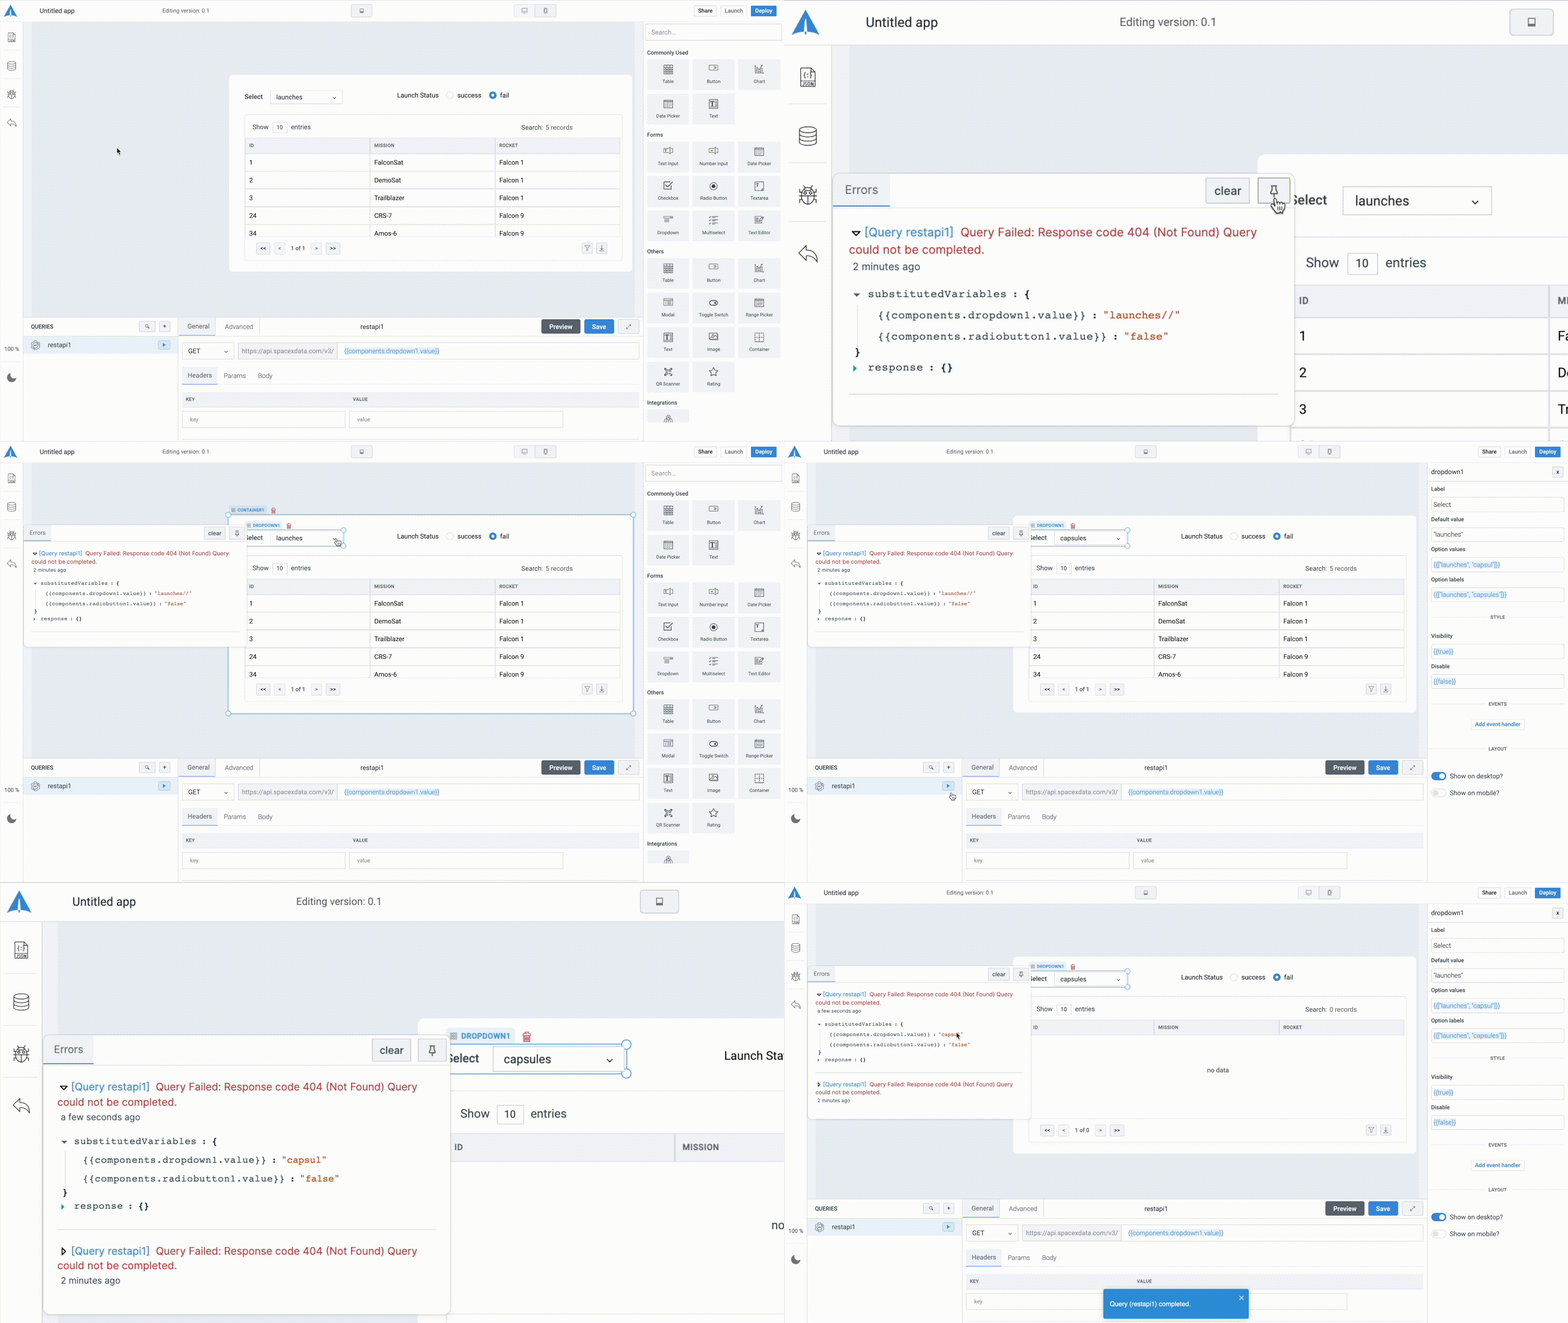
Pin Debugger
You can click on the pin icon at the top-right corner of the debugger if you do not want the debugger to close. The debugger will remain open until it is unpinned.
